The Admiralty Tide Tables
Publications
|
The Admiralty Tide Tables are published by the
United Kingdom Hydrographic Office (UKHO).
The Tables contain the times and heights of high and low waters for over 230 Standard Ports and
time and height differences for over 6000 Secondary ports worldwide for a period of one year.
The tables also outline methods of prediction, the effect of meteorological conditions
on tides and provide additional information on exceptional tidal factors in each area.
The Admiralty Tide Tables are issued in 4 volumes with the following worldwide coastal coverage:
- Volume 1: United Kingdom and Ireland
- Volume 2: Europe (excluding United Kingdom and Ireland), Mediterranean Sea and Atlantic Ocean
- Volume 3: Indian Ocean and South China Sea
- Volume 4: Pacific Ocean
|
 |
Related to the Tide Tables are the publications of the Admiralty Tidal Stream Atlases,
which display, in graphiccal form, the major tidal streams for selected waters of north-western Europe,
including direction and rate at hourly intervals.
Graded arrows illustrate Mean, Neap and Spring tidal rates in tenths of a knot.
There is also a diagram to help you calculate the tidal stream rate for a given date.
More background information on tides and tidal stream are published in the Admiralty Manual of Tides
and the Admiralty Tidal Handbooks.
The Manual of Tides is a largely mathematical, detailed description of tidal theory and its application
to the analysis and prediction of tides and tidal streams.
The Admiralty Tidal Handbooks outline the Admiralty method of harmonic tidal analysis
for long and short observation periods and include information on datums for hydrographic surveys.
Structure and Scope of the Admiralty Tide Tables
The Admiralty Tide Tables is split into two main parts:
Part I: tidal predictions for Standard Ports.
These are the tabulated predictions for the time and height of High and Low Water at
the specific port (sample page). Part II: time and height differences for predicting the tide at Secondary Ports.
Predictions for Secondary Ports are made by applying time and height differences to predictions
at a selected Standard Port (sample page).
In order that the average time and height differences will be as reliable as possible,
it is necessary to select a Standard Port with tidal characteristics, which are similar to those of the Secondary Port.
In some cases this requires the selection of a Standard Port other than the nearest Standard Port.
The Time used in the different tables is always local time without adapting daylight-saving time.
So for british ports (e.g Dover) Greenwich Mean Time (or UT) is used, whereas for ports on the western
european continent (e.g. Le Havre), Mean European Time is used (or UT-1).
In the tide tables for the Standard Ports (Part I), each page will show also the time zone for which
the recorded time values are valid.
The Height of the Tide is recorded in meter above the Chart Datum used in the Admiralty Charts.
The Chart Datum is the reference plane below which all depths are published on a navigational chart.
It is also the plane to which all tidal heights are referred, so by adding the tidal height
to the charted depth, the true depth of water is determined.
By international agreement Chart Datum is defined as a level so low that the tide will not frequently
fall below it. This level is normally approximately the level of Lowest Astronomical Tide,
which is the lowest level range that can occur under average meteorological conditions and
any combination of astronomical conditions.
Notice, that Chart Datum, being dependent on the range of the tide, will vary from place to place!
In the British Isles, Chart Datum is approximately the level of Lowest Astronomical Tide
and all metric charts are referred to this level. Elsewhere, the level of Chart Datum is determined
by the country having primary charting responsibility for the area.
Abbreviations used in the Admiralty Tide Tables:
| A.T.T. | Admiralty Tide Tables | M.H.W.I. | Mean High Water Interval |
| B.S.T. | British Summer Time | M.H.W.N. | Mean High Water Neaps |
| G.M.T. | Greenwich Mean Time | M.H.W.S. | Mean High Water Springs |
| H. | Method of Tidal Prediction | M.L. | Mean Level |
| H.A.T. | Hightest Astronomical Tide | M.L.W.N. | Mean Low Water Neaps |
| H.W. | High Water | M.L.W.S. | Mean Low Water Springs |
| H.W.H. | High Water Height | M.S.L. | Mean Sea Levels |
| L.A.T. | Lowest Astronomical Tide | M.T.L. | Mean Tide Levels |
| L.W. | Low Water | N.H. | Method of Prediction |
| L.W.H. | Low Water Height | U.T. | Universal Time (approx. G.M.T.) |
|
Tide Prediction for Standard Ports
In Part I of the Admiralty Tide Tables, the time and height of high and low water for different
Standard Ports are tabulated.
Additional to these data, the specific course of the tide curve from low- to high- and back to the
next low water is plotted (sample page).
This plot usually consists of two curves one for spring and another for neap tides but since these
plots are normalized in height, they normally do not differ very much.
In order to be useful to determine the height of the tide for a specific time and date, these plots
must be scaled both in time and height.
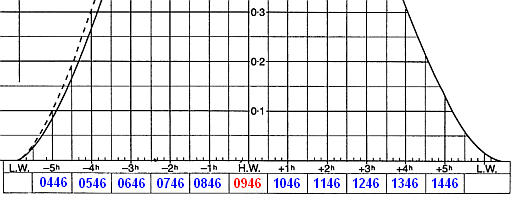
For the time scale, determine the occurrence of high water closest to the specified time and date.
Then enter this time in the box beneath the label "H.W." and fill in the rest of the boxes decrementing
the high-water time by one hour for the boxes on the left and one increment the high-water time by
one hour for the boxes on the right. Notice, that this is only an approximation of the correct time scale,
since to be exact, the time labels must be interpolated between high-water time and the corresponding
low-water times before and after high water.
Example:
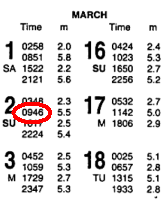
The tide curve for the port of Brest on the morning of March 2nd. 1997 would be marked with 09:46 (UTC+1)
for the high-water and accordingly the rest of the time scale will be as shown below:
 |
 |
The height scale would normally be lablled on the vertical scale, but since the plots are normalized
and use the same level for both low-water occurrences, they must be scaled using the following method.
Mark the level of the first low water on the lower scale at the left side of the plot (marked with "L.W.Hts.m").
Then, mark the level of the high water on the upper scale (labelled with "H.W.Hts.m") and connect the two
marks with a straight line. This is shown as the green line in the plot below:
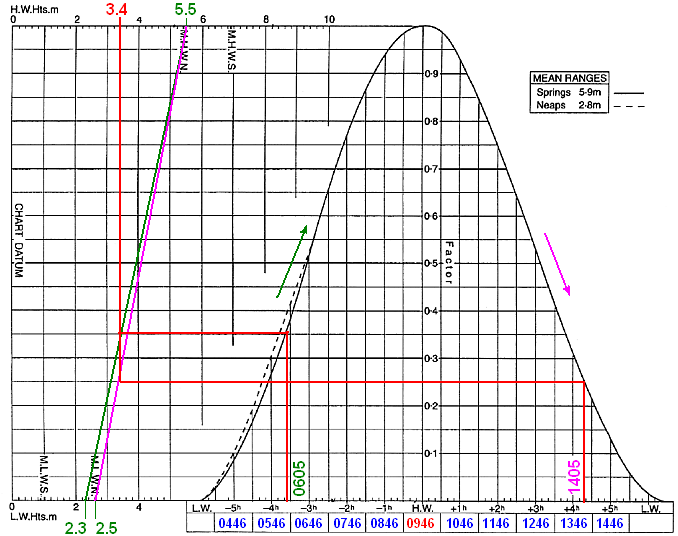
This line is the scaling line for the rising branch of the tide curve (from first low water to high water).
Similar, the scaling line for the falling branch can be constructed: connect the high-water level mark
(at 5.5m) with the next low-water mark (at 2.5m on the lower scale). This is shown as purple line in the
above plot.
The use of the constructed time and height scales, is illustrated with the red lines, showing the occurrence
of 3.4m height of tide (referring to chart datum) during rising and falling tide.
The corresponding times are 06:05 and 14:05 respectively. Over this period of time the height of tide is
more than 3.4m.
Notice, that both the time scale as well as the height scale have a limited (graphical) precision:
about 0.2m for the height and 5 minutes on the time scale.
But considering that the height of the tide is also significantly influenced by weather conditions
an appropriate safety margin must have to be used anyway.
Tide Prediction for Secondary Ports
A useful worksheet for estimation of Height of the Tide (tidal prediction) is available:
Tidal Prediction Worksheet.
See also a sample of the ATT Volume 2 excerpt.
|