Working with Nautical Charts
Traditional nautical charts are printed on paper and produced for marine
navigation.
In addition to providing the basic navigational elements, a chart is a
working document and worksheet used by the navigator to plot courses, ascertain
positions and supervising the location of the ship to the surrounding area.
In conjunction with supplemental navigational aids, it is used to lay out
courses and navigate ships by the shortest and most economically safe route.
Plotting
Plotting is the process of keeping track of the position of a vessel over
time. This is done by recording the successive positions of the vessel
in the nautical chart. The position can be obtained by dead reckoning or
by taking bearings from prominent charted landmarks and constructing Lines-of-Position.
To avoid confusion about the marks, notes and positions draw in the nautical
chart, some conventions are necessary.
They should allow, for instance, to distinguish a position obtained from Dead Reckoning
from a position obtained from bearings to visible charted objects.
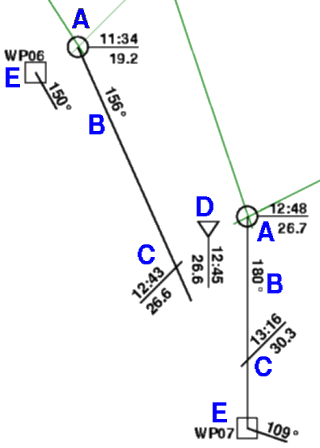
The following is an example of such an implementation:
| A |
Position fixes: fixes obtained e.g. from measured bearings
to charted objects (green lines in the example),
are marked with a circle and horizontally labelled with the time and sailed
distance (trip).
|
| B |
Course lines: only course lines "over ground" are drawn into
the chart. Course lines are labelled with their direction
(e.g. 156° or 180° in the example on the right).
|
| C |
Dead Reckoning fixes: are marked with a diagonal line,
labelled with time and trip.
|
| D |
Estimated Postions: often Dead Reckoning positions must
be corrected for steering errors, additional leeway and current.
These effects are usually difficult to estimate and thus this yields only an
estimated position. Such positions are marked with a top-down triangle labelled
vertically with time and trip.
|
| E |
Waypoints: vertices of the planned track to be sailed,
are marked with a square and labelled with a name. Additionally the direction
(course) to the next waypoint may be drawn into the chart.
While planning a journey, the position of the basic waypoints may be drawn
in the chart and stored in the GPS receiver in advance. This measure is a
safety precaution for situations of unexpected poor visibility or also for
anticipating heavy weather conditions, during which accurate chart plotting
often becomes a difficult task. |
|
|
 |
Basic Navigation Plotting Tools
 |
|
Chart plotting consists mainly of simple graphical and drawing work,
so it is not amazing that the required tools may be quite familiar from school.
Just a few basic tools needed for plotting, yet there are many options
and there are an unlimited number of special gadgets available for specific
tasks in special circumstances.
These special tools may simplify plotting in most situations, but they may
become impracticable e.g. on a rolling ship sailing in heavy weather.
It should be good navigation practice to apply simple but robust plotting
techniques that also work under heavy conditions when accurate navigation
is crucial.
The basic equipment consists of a pair of dividers, protractors and rulers.
Below are a few notes on these simple tools and on how they are used.
|
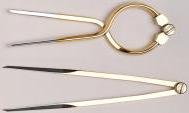
Dividers
Dividers are used to measure distances on the chart using the latitude scale.
For this purpose, the distance between two points on the chart is marked with a
divider and transfered to the latitude scale.
Dividers are available in different styles with specific advantages and disadvantages.
All dividers consist of a pair of "legs", which can be rotated around a common point.
The legs are pulled open or squeezed closed. Some dividers can be operated with one
hand (one-hand divider as shown on the top of the picture).
Other have a screw knob close at the rotation point, which allows fine control of the
position of the "legs".
|
 |
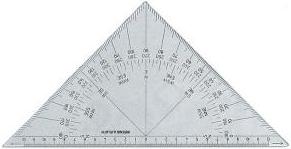
Protractors
A protractor is a tool that allows to draw into a chart lines in a specific direction,
or lines intersecting with a particular angle or also to measure angles between
intersecting lines.
These lines, can be course lines, bearings to charted objects or Meridians or Parallels.
Protractors consist of a half-circle (180°) or full-circle (360°) provided with
a degree scale with tics for each integral degree value.
Protractor triangles have a half-circle graduator scale in the triangular form.
Besides drawing and measuring angles, protractor triangles are well suited for
parallel shifting of a base line (e.g. course or bearing), by guiding one of
the short sides with a ruler.
Full-circle protractors have a quadratic shape.
Some full-circle protractors additionally have a rotatable ruler fixed to the center
of the protractor.
|
 |
Rulers
Rulers are useful for drawing long lines in a chart or to extend one of the
sides of the protractor if it does not have a rotatale ruler. In addition with
a protractor triangle, rulers may also used for parallel shifting of course lines
or bearings on the nautical chart.
A variation of the simple ruler is a parallel ruler. This is a tool consisting
of two rulers, which are fixed such that they always remain parallel to each other.
This parallel ruler can be used to draw a line some distance away but parallel to
a base line.
To use it, align one side of the rulers with the base line and hold down that side
of the tool. The second ruler can be moved while still holding down the first ruler,
and will always be parallel to the base line, to which the tool has been aligned.
If the new location of the base line cannot be reached in one step, the rulers
can "walk" the chart to the destination by moving alternately one of the rulers
while holding down the other one.
Working with Navigation Plotting Tools and Nautical Charts
Drawing Bearing Lines
A bearing to a charted object -> LoP
Two bearing Lines -> position fix (graphical procedure) in the map = relative to charted hazards
From - To (±180°)
Plot it into the Chart
Measuring Distance
|
Distances are measured using the chart's latitude scale. Assuming that one minute
of Latitude equals one nautical mile (nm) introduces no significant error.
Since the latitude scale on Mercator charts expands as Latitude increases,
distances should be measured on the latitude scale closest to the area of
interest.
Dividers are used to transfer a distance from the chart to the latitude scale.
The legs of the divider are pulled apart or squeezed together,
such that they cover exactly the distance to be measured.
Then - without changing the angle between the legs - the divider
is moved to the latitude scale in about the same Latitude
as the area of interest.
From the latitude scale, the distance between the legs is measured
in minutes of Latitude and converted one-to-one into nautical miles.
|
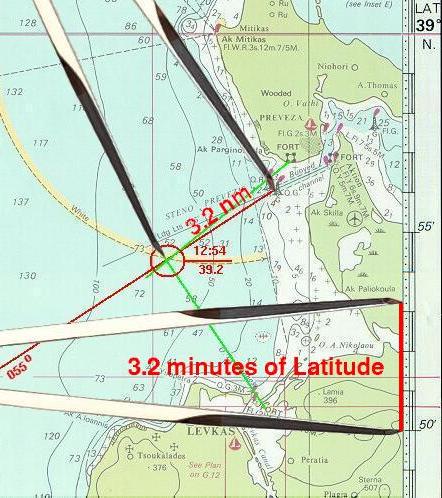 |
The above example shows the following situation:
aproaching the Preveza Channel from the SW (course 055°T),
a position fix at 12:54 is obtained by two bearings: one to the fort at the
entrance of the Preveza Channel and one to the fort at the
entrance of the Levkas Channel.
In order to know the time, when the lighted buoyes marking the
entrance of the Preveza Channel will be reached, first the
distance to these buoyes has to be determined.
This is done using a divider.
The legs of the divider are pulled apart such that they cover
the distance from the position fix to the buoys.
Then - without changing the angle between the legs - the divider
is moved to the latitude scale in about the same Latitude
as the position fix.
In the example the legs are 3.2 minutes of Latitude apart.
This is equal to a distance is 3.2 nm.
After this, the distance is divided by the speed of the vessel to obtain
the time it will take to cover that distance.
Assuming that the vessel is sailing at a constant speed of 4.2 kts,
the buoys at the channel entrance will be reached at 13:40
(about 45 minutes after the position fix at 12:54).
|