The Nautical Chart
The Nautical Chart is one of the most fundamental tools available to the mariner.
It is a graphical image of the marine environment containing basic information on:
water depth and configuration of the sea bottom, a description of the shoreline, adjacent land and topographic features locations of navigational hazards and navigational aids, such as buoys
and beacons, lighthouses, shipping channels and restricted areas, tides and resulting currents, the characteristics of the Earth's magnetism.
|
|
In addition to providing the basic navigational elements, a chart is a
working document and worksheet used by the navigator to plot courses, ascertain
positions and supervising the location of the ship to the surrounding area.
In conjunction with supplemental navigational aids, it is used to lay out
courses and navigate ships by the shortest and most economically safe route.
Traditional nautical charts are printed on paper and produced for marine
navigation.
The reproduction of the three-dimensional Earth on the plane surface
of a chart, results in various distortions. For navigational purposes a
special projection technique was developed by Gerard Kremer (Mercator),
a Flemish cartographer (1512-1594). This conformal
Mercator projection has two main features:
The angles between three object in the chart is the same as the angles
between the real objects which they represent. This allows to transfer
bearings from the "real" world directly into the chart.
A straight course appears as a straight line in the chart. This allows
the navigator to determine a fixed (compass) course between any two points
in a Mercator chart.
To fulfil these demands Mercator charts must have Parallels and Meridians
which are straight and parallel as well as perpendicular to each other.
Since in the "real" world Meridians converge to the Poles, the scaling
factor of a Mercator chart cannot be constant. Instead, the scaling factor
increases with a factor 1/cos(Latitude). At the Poles (Latitude=90°)
this factor tends to infinity, making it impossible to show the polar regions
on a standard Mercator chart. For polar excursions maps based on other
projection techniques are used.
Navigational Charts and Coast Pilots are integral components necessary
for the safety of life and property and safe and efficient navigation.
In case of grounding, collision and other accidents, charts become
critical records for reconstructing the event and assigning liability.
Chart fundamentals
Symbols and Abbreviations
Much of the information contained on charts is shown by symbols and standardized
abbreviations. The symbols indicate the the correct position of the feature
to which they refer.
Nautical nautical charts are generally published by national hydrographic
institutes or other charting agencies. These charts should conform to the
recommendations of the International
Hydrographic Organization (IHO) located in Monaco, regarding the use
of color and symbols, abbreviations and chart features. They are described
in the "Chart No. 1, Nautical Chart Symbols and Abbreviations".
If in doubt about the symbols and abbreviations used in a foreign chart,
the navigator should should obtain the Chart No. 1 from the country which
produced the chart.
Chart Datum and Soundings
A datum is defined a any numerical or geometrical quantity or set of such
quantities which serves as a reference point to measure other quantities.
In geodesy, as well as in cartography and navigation, two types of
datum must be considered: a horizontal datum and a vertical datum.
The horizontal datum forms the basis for computations of horizontal position.
The vertical datum provides the reference for measuring heights and depths.
Horizontal Datum
A horizontal datum may be defined at an origin point on the ellipsoid
(local datum) such that the center of the ellipsoid coincides with the
Earth's center of mass (geocentric datum).
Many countries have developed national datums which differ from those
of their neighbours. Accordingly, national maps and charts often do not
agree along national borders. Datums throughout the world use different
assumptions as to origin points and ellipsoids.
The most famous datums are:
North American Datum, 1927 (NAD 27) has its origin at Mead's Ranch
in Kansas and is based on the Clarke Ellipsoid of 1866.
European Datum (ED) was based on the origin at Potsdam in Germany.
It has been used for surveys in Europe, Africa and Asia. It is also possible
to connect the European Datum with the Russian Pulkova,1932 system.
Tokio Datum has its origin in Tokyo and is based on the Bessel Ellipsoid.
Indian Datum is the preferred datum for India and adjacent countries
in South-east Asia. It is computed on the Everest Ellipsoid with its origin
at Kalianpur, India. It is largly the result of the work of Sir George Everest
(1790-1866), Surveyor General in India from 1830 to 1843.
These different datums have been used for cartographic surveys around
the world for about 50 years, but are being replaced now by datums based
on the World Geodetic System. By the late 1950's the increasing
range and sophistication of weapons systems had rendered local or national
datums inadequate for military purposes. These new weapons required datums
at least continental in scope. in response to these requirements, the U.S.
Department of Defence generated a geocentric reference system to which
different geodetic networks could be referred. Efforts of the different
departments involved, led to the development of the World Geodetic System
of 1960 (WGS 60).
In 1966, the responsibility for the further development and improvement
of the World Geodetic System was transferred to the World Geodetic System
Committee. Continued research and refined methods of triangulation ultimately
led to the World Geodetic System of 1984 (WGS 84).
The WGS system is not based on a single origin, but on many points,
fixed with extreme precision by satellite fixes and statistical methods.
The result is an ellipsoid which fits the real surface of the earth, or
geoid, far more accurately than the mathematically based ellipsoids used
for the older geodetic systems.
Although the WGS system has been established world wide since more than
20 years, nautical charts are still based on the older local national geodetic
systems. One impact on navigation of these different datums appears when
a navigation system provides a fix based on a datum different from that
used for the nautical chart. A typical example is a WGS 84 based fix as
obtained from a GPS receiver and a chart based on e.g. European Datum.
The resulting plotted position may be different from the actual location
on that chart. The difference is known as a datum shift. Currently
issued charts have a note in the title block on the datum shift between
the WGS 84 system and the datum used for the chart:
GPS and other modern positioning systems use the WGS datum. If the chart
used is on another datum, a datum correction (datum shift) must be applied
when plotting the GPS position on the chart. If the datum of a plotted
feature is not known, position inaccuracies will be the result and a margin
of error must be taken into account.
Vertical Datum
All depths indicated on charts are reckoned from a selected level
of water, called the chart sounding datum. The various chart datums
are explained in Tides and Tidal Currents.
Depths shown on nautical charts are the least depths to be expected
under average conditions. On charts based on foreign surveys, the datum
is that of the original authority. When it is known, the datum used is
stated on the chart. In some cases where the chart is based upon old surveys,
particularly in areas where the range of tide is not great, the sounding
datum may not be known.
For most charts, the chart sounding datum is mean lower low water or
mean low water spring. On charts of areas where tidal effects are small
or without significance, the datum adopted is an arbitrary height approximating
the mean water level.
Several effects will have influence on the actual water depth:
chart datum is usually only an approximation of the actual mean value,
water depth is influenced by wind and current and other seasonal changes.
Charts show sounding in several ways, Numbers denote individual soundings.
These are supplemented by depth contours, lines connecting points of equal
depth. These lines present a picture of the bottom. The types of lines
used for various depths are described in Section I of Chart No. 1.
Information on Sea Bottom and Earth Magnetic Variation
Abbreviations listed in Section J of Chart No. 1 are used to indicate what
substance forms the bottom. Knowing the characteristics of the bottom is
most important when anchoring. However, navigation Pilots usually give
a much better and more extended description of anchorages than can be shown
on charts.
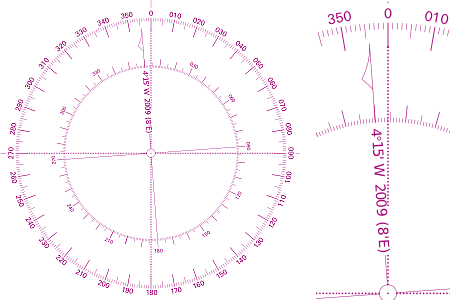 Compass roses are placed at convenient locations on Mercator charts to
facilitate the plotting for bearings and courses. The outer circle is graduated
in degrees with zero at True North. The inner circle indicates Magnetic
North. On most charts the magnetic variation at a given date is recorded
in the center of the compass rose. Also the annual change is given to permit
correction of the magnetic variation at a later date.
Compass roses are placed at convenient locations on Mercator charts to
facilitate the plotting for bearings and courses. The outer circle is graduated
in degrees with zero at True North. The inner circle indicates Magnetic
North. On most charts the magnetic variation at a given date is recorded
in the center of the compass rose. Also the annual change is given to permit
correction of the magnetic variation at a later date.
Local magnetic disturbances of sufficient force to cause noticeable
deflection of the magnetic compass - called local attraction - are indicated
by notes in the chart. Such local magnetic disturbances may occur in the
vicinity of underwater power cables.
Maintaining Charts
Charts are useless, if the information in the chart is incorrect and outdated.
The charting agencies publishing nautical charts will also publish changes
that have been recorded for their charts in regular intervals (usually
weekly). These changes are published in the "Notices to Mariners".
New charts are released in much longer intervals. Between new releases
of a chart, mariners will have to update their purchased charts using the
"Notices to Mariners".
|