Plotting Sheets
Plotting sheets are "charts" designed primarily for open ocean navigation,
where shorelines, visual aids to navigation and water depths are of no
importance to navigation. Plotting sheets are also used for plotting positions
and Lines-of-Position obtained by methods of Celestial Navigation.
Commercially available plotting sheets contain a Mercator grid for
a specific Latitude.
This grid provides the correct ratio between the angular distances in Latitude
and Longitude similar to the nautical charts used for navigation in the
corresponding Latitude. In this way the same feature concerning measuring
distances by evaluating the angular latitude distance is valid for these
plotting sheets.
Sheets with a prepared Mercator Grid according to the mid-latitude of the chart
are available from the
Book with Mercator Plotting Sheets
for a Latitude range from 0° to 69°.
The plotting sheet is valid only for this specific value of Latitude but can be
used on both hemispheres, North or South.
The Meridians are initially not labelled, so each latitude-specific
plotting sheet can be used for any Longitude.
The Meridians - and also the remaining Latitudes - will be labelled such that the
required plotting area (e.g. from initial to final plotting position) is available
on the sheet.
Constructing Small-Area Plotting Sheets
A plotting sheet with a Mercator scale for a specific Latitude Lat not
covering more than a couple of degrees of Latitude, can be simply made from a
blank sheet of paper.
There are two ways to do this depending on how the scale of the chart is fixed:
by Latitude or by Longitude.
Plotting Sheet with selected latitude scale
may be produced as described in the following procedure:
Draw a set of Parallels of equal Latitude as horizontal lines, spaced
by a vertical distance of dY centimetres. Draw the primary Meridian as a vertical line intersecting the central
Parallel at the center of the chart. Draw a circle at this center with a radius of dY. Label the central Parallel with the value of the corresponding Latitude Lat,
(S 30° in the example below) and draw an inclined construction line originating from
the center of the chart and inclined against the central Parallel by the latitude angle. Draw the next Meridian through the intersection point of the inclined
construction line with the central circle. Complete the set of vertical meridian lines,
spaced by a distance dX = dY * cos(Lat) centimetres as required for a Mercator Grid. Scale the chart by defining the size of dY: if dY represents one degree
of Latitude then dX represents one degree of Longitude; if dY represents one minute
of Latitude then dX represents one minute of Longitude. Label all Meridians and all Parallels of equal Latitude. Graduate the left and/or right Meridian into convenient units to enable
distance measurement from the chart.
|

Move, and keep the cursor over the chart to see an animation of the construction
principle |
Plotting Sheet with selected longitude scale
may be produced as described in the following procedure:
Draw a set of lines of equal Longitude as vertical lines, spaced
by an horizontal distance of dX centimetres. Draw a central horizontal line representing the Parallel of the
mid-latitude of the plotting area. Label the central Parallel with the value of Latitude Lat,
(S 30° in the example below) and draw an inclined construction line originating from
the center of the chart and inclined against the central Parallel by the latitude angle. Draw a central circle through the point where the inclined construction line
intersects with the next meridian line. Draw the upper and lower horizontal Parallels at the points where the central circle intersects
with the central Meridian. Through this construction, the Parallels are spaced by a distance
of dY = dX / cos(Lat) centimetres as required for a Mercator Grid. Scale the chart by defining dX: if dX represents one degree of Latitude
then dY represents one degree of Longitude; if dX represents one minute
of Latitude then dY represents one minute of Longitude. Label all the Meridians and all the lines of equal Latitude.
Graduate the left or right Meridian line into convenient units to enable
distance measurement from the chart. |
Move, and keep the cursor over the chart to see an animation of the construction
principle |
Remarks
The above procedures differ only in the way the initial scale of the chart is defined.
The first procedure has a predefined vertical spacing of the Parallels, whereas
the second procedure allows for a predefined horizontal spacing of the Meridians.
The plotting sheet can be used as a usual nautical chart, for plotting course
lines, lines of position, positions of the vessel etc.
As in all Mercator charts, distances are obtained from the left- or right-hand scale of
the plotting sheet.
If the plotting sheet is constructed with selected latitude scale and dY
is defined as one minute of Latitude per centimetre, distances can be simply taken
from the sheet by using a ruler with a centimetre scale.
Notice: plotting sheets constructed with the above described techniques, use a
constant ratio of Latitude spacing to Longitude spacing over the entire sheet.
For this reason, they must be limited to a couple of degrees of Latitude,
otherwise they will be unprecise.
The construction of large-scale Mercator grids is slightly more complicated and is
described in the next section.
Constructing Large-Scale Plotting Sheets
In order to construct a plotting sheet, which is also valid for a large range
of Latitudes, the basic characteristics of the Mercator grid must be understood:
Meridians are straight lines running North-South and are spaced a fixed distance
dX from each other.
Parallels are also straight lines running East-West (perpendicular to the Meridians)
and are spaced a distance dY from the next one.
The value for dY depends on the value of the current Latitude Lat:
dY = dX / cos(Lat).
At the Equator, the Parallels are spaced at the same distance as the Meridians
(dY = dX).
The closer to the Poles, the larger the spacing of the Parallels (dY > dX).
Constructing the appropriate Mercator grid valid also for a large range of Latitudes
may then be done by repeating the above procedure of constructing a plotting sheet
with selected longitude scale for the different Latitude values available
in the large-scale chart.
The Universal Plotting Sheet
The elaboration of a celestial fix according to the method of St. Hilaire does
not necessarily require a Mercator style plotting sheet.
I am indebted to Tony for sending me the following method, he found in an old
marine textbook.
Instead of preparing a Mercator plotting sheet for doing the graphical elaboration
of the Lines-of-Position and a fix, the "Universal Plotting Sheet" starts with
a blank sheet of paper and an arbitrary distance scale, e.g. one centimetre per Nautical Mile.
This scale is used over the entire sheet for both main directions: North-South and East-West.
Notice that a Mercator Sheet would have different scales for these directions.
Near the center of the plotting sheet, the Assumed Position (AP) is chosen and the
local Circle of Latitude and local Meridian is drawn as X and Y axis.
The graphical elaboration of the celestial fix is performed the same way as on a
Mercator Sheet: draw the Azimuth lines from the Assumed Position, draw the
Lines-of-Position at the correct Altitude offsets and if required, shift the
first LoP over the travelled distance between the two observations.
This finally yields a fix with the current position (at the moment of the second observation).
Since this method does not use a Mercator Sheet, the coordinates of the graphically
obtained position fix cannot be directly read from the plotting sheet's axis.
Instead the offset of the fix to the Assumed Position must be evaluated.
For the Latitude, the North-South distance between the fix and the Assumed Position
can be directly translated into a difference in Latitude using the pre-defined
chart scale:
Latitude_Difference_in_Minutes = NS_Distance_in_Nautical_Miles
For the Longitude however, the correct ratio between Latitude and Longitude
scales must be taken into account.
Numerically, the ratio is equal to the cosine of the local Latitude (LatAP):
Longitude_Difference_in_Minutes = EW_Distance_in_Nautical_Miles / cos(LatAP)
At higher Latitudes, the Meridians are "closer" than they are at the Equator,
so at higher Latitudes, there are more "Minutes of Longitude per Mile" than there are at low Latitudes.
Graphically, the correct Longitude difference can be obtained from the East-West
distance with the following simple trigonometric construction:
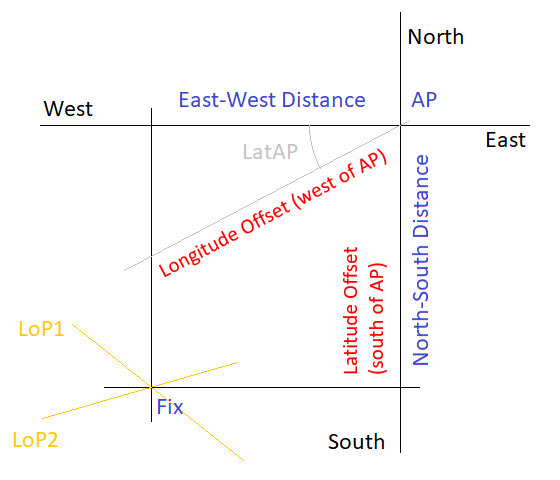
The scale of the plotting sheet is used to translate the Latitude and Longitude offsets
(shown in red in the sketch above) to Minutes-of-Arc with one Nautical Mile corresponding
to one Minute-of-Arc.
|